Text, letters, numbers, symbols! All these together make somewhat of a jumbled mess and reading it can be gruesome for most. Not everyone even has the time to go through statistics even though they might be extremely important in making a point. You have a website, you want to market your product, and using statistics can be a great way to prove your product’s greatness. Data Visualization is the real deal here as data & visuals together are like Hamburger & Fries, they’re just meant to be together.
How is Data Visualization Related to Mobile Web Experience?
Mobile web optimization is talked a lot but usage of data in the form of visualization is rarely made a part of the conversation. A website’s user experience is obviously different from how it’s seen on different digital devices. On mobile phones or devices, the experience matters way more than on a desktop, this is largely because of the fact that mobile devices are smaller in size. Also, most people are ignorant of the fact that mobile web experience is just as important as the desktop experience.
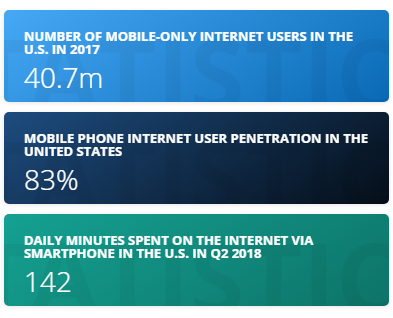
Statistics from Statista highlight the importance of optimizing web mobile experience. In 2017, the number of mobile users in the United States was 40.7 million. That’s a big chunk of number that you should focus on.
Did you notice the fact that a few blocks of data as shown above is way more effective in conveying information as compared to just text? This is how data & a visual representation can change the way you present information to an audience. We always consider data visualization a central part of web mobile experience.
Set Aside Tradition & Be Creative:
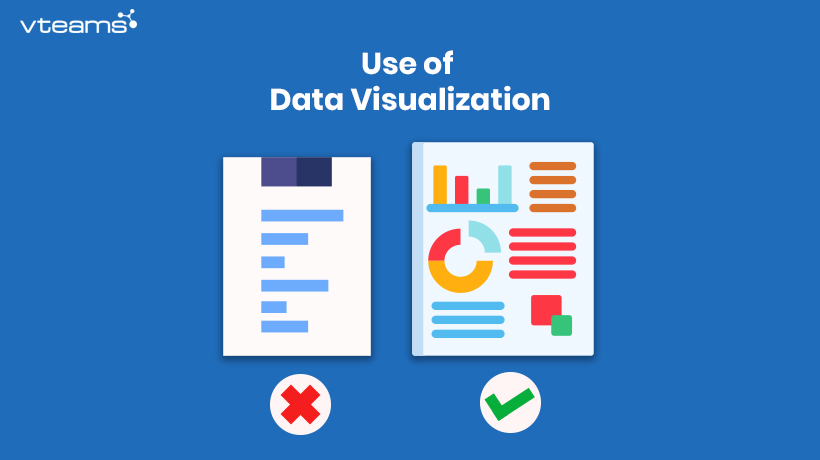
What do you normally think about when you hear the word data visualization? We bet it’s a bunch of bad looking graphs such as bars, pie charts, or some form of a histogram. If you want to use data visuals, it’s always better to come up with creative ways of displaying information rather than taking the traditional route. Even if there’s not a lot you can play with or maybe you don’t have enough statistics you can still find creative ideas to display your written content. The fact is, visuals are way more attention-seeking as compared to text alone. Go ahead and churn up some good ideas.
When Data Visualizations become Interactive:
There’s a certain way you can interact with your visitors as well. If you’re trying to convey a lot of information in let’s say a bar graph, then a static graph wouldn’t really work well on mobile. As mobile devices generally have smaller screens and displaying large bits of data in the form of a graph can be a little daunting. However, here’s when you can use interactivity as a medium to get your visitors truly engaged. If you have a bar graph with a heavy dose of information, then you can make bars clickable. Once clicked, these bars will zoom out so that information can be read.
By playing around a bit, you can always find creative ways to make the experience even more creative. Microsoft’s Power BI is a great data visualization tool that you can use to get some amazing visuals.
Condense the Information:
The reason why we are stressing on data visualization is because of the fact that you can condense large bits of information in a visually stunning display. This gives you an edge in terms of getting user engagement as well as conveying your information in an effective manner. Through data visualization, you can easily save time and get your point across without taking up your visitor’s unnecessary time.
The Navigation Aspect:
Imagine how cool and fast your website’s navigation could be with an enhanced mobile web experience through data visualization. When you use data that is interactive as well as creative in different ways then navigating your website becomes a lot more fun. Especially, when it comes to switching between different pages within a website. Also, if you decide to interlink your webpages through a graph that’s possible as well. Navigation is really about how well you can make your visitors go from one webpage to another with ease.
In a Nutshell:
We like to think of data visualization as a form of storytelling. This is where it gets interesting because it doesn’t even have to be statistics alone, it can be content represented in the form of visuals. A higher user experience should be your priority as you want your visitors to get something out of their visit. Be it information or availing any service. If you’re looking to improve your website’s user experience, then don’t hesitate to contact vteams!


0 Comments