React Native has emerged as a popular framework due to its ability to create cross-platform applications efficiently in this modern era of development. Its robust capabilities to optimize the development process also ease debugging and proves to be an invaluable tool for React-native-debugger.
In this blog, we will explore different answers for using a react native debugger query while getting an insight into all its features, and demonstrations to leverage it effectively for streamlining the react native workflow.
What is React Native Debugger?

React Native has been built on top of the popular open-source Electron framework. It offers developers a user-friendly and feature-rich environment for debugging their apps. Not just that but this standalone debugging tool enhances the performance of specifically the React native applications.
Its efficiency is the combination of Chrome Developer Tools with its own robust features that are enlisted below.
Installation and Setup
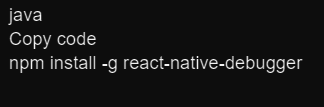
To get started, ensure that you have Node.js installed on your system. React Native Debugger can be installed via npm, using the following command:
Launch React Native Debugger
You can use the following codes for launching react native debugger. S
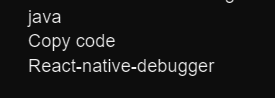
This will open the React Native Debugger window, where you can start debugging your React Native apps.
Key Features of React Native Debugger

React native debugger has become an indispensable tool for react developers as it helps them track and fix errors instantly in a react native application.
Besides it has many features that make debugging easier and elevate its worth.
Element Inspector
The powerful element inspector in react native debugging process enables inspection of the hierarchical structures as well as the react native components in real time.
Component props and states can be modified and viewed easily to streamline the identification and fixation of errors.
Network Inspector
The built-in network inspector helps to monitor the network requests made by an application. With a detailed display of information about all requests including headers, response payloads, and response times it eases tracking down network-related issues.
Besides, the network inspector is another agent in the react native debugging process that optimizes performance.
Redux DevTools Integration
It is important to develop a seamless integration between React native debugger and Redux Devtools the reason is that they enable inspection and debugging of your Redux store.
By doing this you will able to view actions, state changes, and time travel to different states for analyzing an application’s behavior.
Console and Debugger
The console and debugger in react native are similar to Chrome developer tools in terms of their sturdiness and functionality. Using these resources you can easily define breakpoints, step through your code, and scrutinize variables during runtime.
Even though both console and debugger work for the same purpose of improving performance but they have many other different roles. The react native console log print messages for the end users and debug to gain better insights into app behaviors. The debugger on the other side facilitates reading between the code strings and finding out the possible errors caused by nested functions.
Breakpoints
Setting up breakpoints in your code can pause execution at specific intervals of time during react native debugging. This process will help you view the call stack and focus on the main points of your code while helping you analyze bugs.
So whenever you are looking forward to create a react native app, you need to inspect its state by stepping through your code line by line via defining the breakpoints.
Variable inspector
The variable inspector allows you to view the values of variables in your app. This can be helpful for debugging errors or for understanding how your app is behaving.
It supports the R Kernel Python for collecting the variables and displaying them in a floating window. If you are learning how to debug react then it is significant to know about variable inspector because they can help you identify the null and unidentified variable values.
Call stack
Call stack helps in the speedy execution of a program and observation functions. It also identifies the source of errors by seeing which functions have returned.
In react native debugging the call stack also plays a vital role in showing the sequence of function cells leading to the specific points in your code.
Memory profiler
The memory profiler allows you to see how much memory your app is using. This can be helpful for debugging memory leaks or for optimizing your app’s performance.
This way it prevents apps from crashing or freezing by performing a deep-rooted analysis of memory consumption.
Methods for Using React Native Debugger
React native debugger tools are preferred to be used for a lot of reasons but can only be advantageous if you follow the proper techniques. Now that we have explored the key features, let’s see how to utilize React Native Debugger effectively in your React Native development process:
Connecting to a React Native App
To debug a React Native application using React Native Debugger, you need to modify the app’s configuration.
Open the file App.js or index.js in your project and add the following code at the beginning:
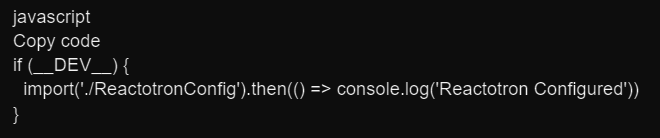
This code imports the Reactotron configuration file, which connects your app to React Native Debugger. Make sure you have Reactotron installed as a dependency in your project.
Inspecting Components
React Native makes apps scalable and beneficial for developers, business owners, as well as for end-users. Therefore by following these steps, you can inspect components well to avoid issues.
- Launch your React Native app using the usual react-native run-android or react-native run-ios command.
- Then, open React Native Debugger and select your app from the dropdown menu at the top.
- You can now use the element inspector to inspect and modify component props and states in real time.
Debugging Redux
If your app uses Redux, React Native Debugger integrates seamlessly with Redux DevTools.
- You can access the Redux DevTools by selecting the “Redux” tab in the React Native Debugger window.
- Now have the authority to inspect actions, state changes, and perform time-travel debugging here.
Hope It Had Been Helpful!
No app can exist without being tested before its launch and without being upgraded with the latest versions to make it more scalable. The same happens when you create react native app, you need to eliminate the errors to ensure better performance.
Therefore, this article has disclosed all about how to use react native debugger. Hope now you will have a problem-free application.